
Cheltenham's average home is £322,758, up £927 in a year and £10,296 below April. Flats are down 2.3%; only the Forest of Dean did worse in Gloucestershire.
The average home in Cheltenham was worth £322,758 in July 2026. That is only £927 more than a year earlier, a rise of 0.3%. HM Land Registry published the figures on 16 September in its UK House Price Index.
It is the third monthly fall in a row. The borough’s average has dropped £10,296 since April, when it stood at £333,054. That is a fall of 3.1% in three months.
On the index’s revised figures, annual growth in June was 2.9%. Cheltenham is now growing more slowly than England as a whole, where prices rose 1.1%.
Three months of falls
These are the index’s current figures for Cheltenham. The index revises recent months as late sales are registered, so they differ slightly from earlier releases.
| Month | Average price | Change on the month |
|---|---|---|
| March 2026 | £325,923 | |
| April 2026 | £333,054 | +2.2% |
| May 2026 | £329,793 | -1.0% |
| June 2026 | £327,595 | -0.7% |
| July 2026 | £322,758 | -1.5% |
July’s figure is also £14,153 below Cheltenham’s high in the current series, £336,911 in October 2024.
One borough’s monthly figures are noisy, and July’s is the first estimate. The June figure was revised up by £2,196 between releases. So a single month can move. Three falls in a row is a clearer signal than any one of them.
How Cheltenham compares
Of Gloucestershire’s six districts, Cheltenham had the second slowest growth. Only the Forest of Dean did worse, with prices down 1.7%.
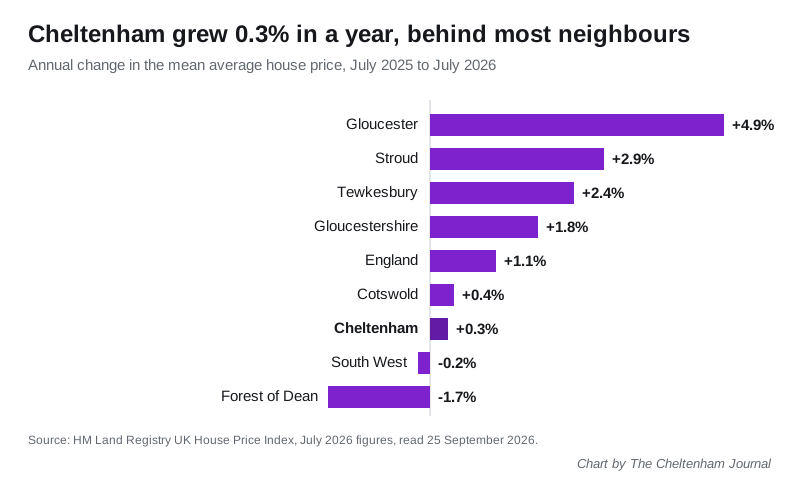
| Area | Average price, July 2026 | Change in a year |
|---|---|---|
| Cotswold | £421,125 | +0.4% |
| Stroud | £351,736 | +2.9% |
| Tewkesbury | £325,898 | +2.4% |
| Cheltenham | £322,758 | +0.3% |
| Forest of Dean | £286,888 | -1.7% |
| Gloucester | £240,718 | +4.9% |
| Gloucestershire | £316,822 | +1.8% |
| South West | £302,298 | -0.2% |
| England | £293,479 | +1.1% |
Tewkesbury borough is still dearer than Cheltenham on average, now by £3,140. Gloucester, which grew fastest in the county, is £82,040 cheaper.
Flats are falling
Every type of home in Cheltenham slowed. Flats went backwards.
| Property type | Average price, July 2026 | Change in a year |
|---|---|---|
| Detached | £625,407 | +0.3% |
| Semi-detached | £394,668 | +1.6% |
| Terraced | £321,880 | +1.2% |
| Flat or maisonette | £201,009 | -2.3% |
Semi-detached and terraced homes are still rising, but by less than half the rate the index showed for June. Detached houses are flat on the year.
First-time buyers paid an average of £269,188, up 0.4%. Buyers who had owned before paid £398,858, also up 0.4%. The gap between the two is £129,670.
A note on the figures
The UK House Price Index is a mean average, not a median. A few very expensive sales can pull it up or down. Our Cheltenham house prices page uses Land Registry sale records instead, with the median price for every postcode sector.
The figures here were read from the Land Registry’s data service on 25 September 2026. The next release, with August’s figures, is due in October.
What it means for you
- If you are buying, the average Cheltenham home costs about £10,300 less than it did in April. Flats are 2.3% cheaper than a year ago.
- If you are selling a flat, the average has fallen £4,724 in a year. Pricing to last year’s comparable sales may be optimistic.
- If you are buying your first home, the first-time buyer average of £269,188 rose just 0.4%. Prices have barely moved in a year.
- If you are comparing towns, Tewkesbury borough is £3,140 dearer on average and rose 2.4%. Gloucester is £82,040 cheaper and rose 4.9%.
More Cheltenham local information: house prices by postcode, council tax bands, bin collection days, trains to London.
Sources
- HM Land Registry, UK House Price Index for Cheltenham, July 2025 to July 2026, including monthly averages and averages by property type and buyer status.
- HM Land Registry, UK House Price Index for Tewkesbury, Gloucester, Stroud, Cotswold, Forest of Dean, Gloucestershire, the South West and England.
- GOV.UK, UK House Price Index for July 2026, published 16 September 2026.
Have your say